Multi-Asset Overview Pattern
A design pattern for presenting multiple assets on a single screen to support rapid perception, comparison, and anomaly detection. This layout minimizes display complexity, reduces search cost, and strengthens all three levels of Situation Awareness by structuring information consistently across assets.
Note:
To view dashboard images in a larger format, right-click on the picture and select "Open Image in New Tab."
What This Pattern Is
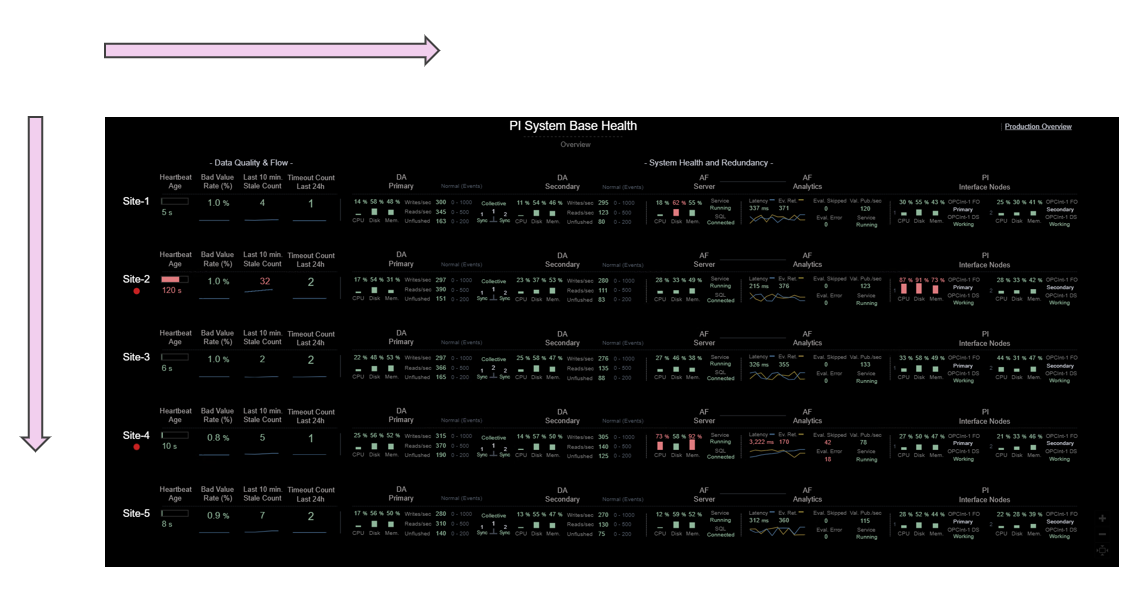
This pattern displays one row per asset, allowing system administrators to quickly understand the condition of a single asset (horizontal scanning) and compare a specific metric across all assets (vertical scanning).
- Asset rows group indicators by operational meaning (Data Flow, Archive Health, Analytics, Interfaces, etc.).
- Horizontal scanning provides a complete snapshot of one asset at a glance.
- Vertical scanning reveals outliers and comparative differences immediately.
- Goal-oriented grouping reduces search effort and speeds comprehension.
- Consistent color cues and trends make normal vs. abnormal states immediately perceptible.
Why This Pattern Matters
Monitoring multiple assets often requires switching across displays, tabs, or systems — fragmenting attention and increasing cognitive load. This pattern solves that by consolidating all critical indicators into a single pane.
- Reduces display complexity (Few) by keeping everything visible at once, eliminating multi-window navigation.
- Minimizes search cost (Endsley) through predictable left-to-right and top-to-bottom information flow.
- Supports Level 1 SA via clear color coding, easy follow layout, and reduced visual noise.
- Supports Level 2 SA by visually linking components (DA, AF, Interfaces) to form a coherent operational model.
- Supports Level 3 SA through small trends that reveal developing issues and temporal patterns.
The result is faster detection of anomalies, improved comprehension of system state, and better projection of future conditions.
Pattern Demonstration
Below is a demonstration of this pattern applied to multiple PI Systems. PI Systems in this example act as a stand-in for any repeated asset type.
🎥 Demonstration Video
Silent demo — visuals only
📷 Dashboard Views
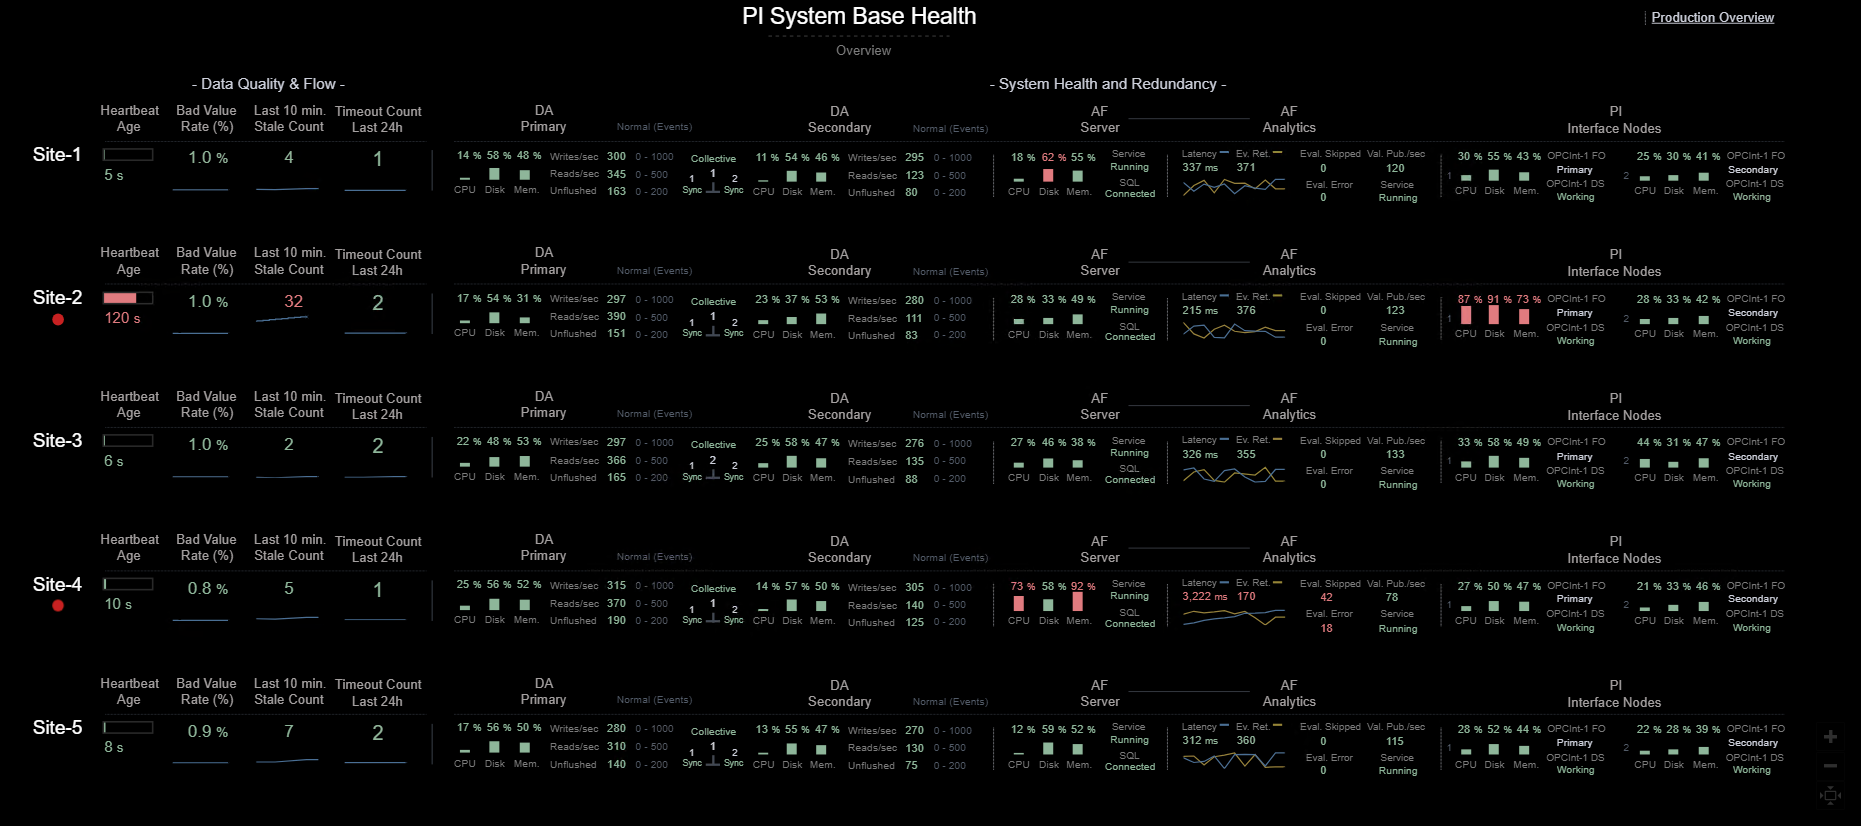
- One Screen: A single pane showing performance of all assets for at-a-glance Situation Awareness.
- Arrangement of Information: Display complexity is reduced through left-to-right
goal-aligned ordering and top-to-bottom asset alignment for easy comparisons.
-
Key Components Monitored:
- Data Quality & Flow — heartbeat, stale count, bad value rate.
- Data Archive — CPU, disk, memory, writes/reads/sec, unflushed events.
- AF Server — CPU, memory, service status.
- AF Analytics — latency, evals/sec, errors, skipped counts.
- PI Interfaces — node health, failover state, connection status.
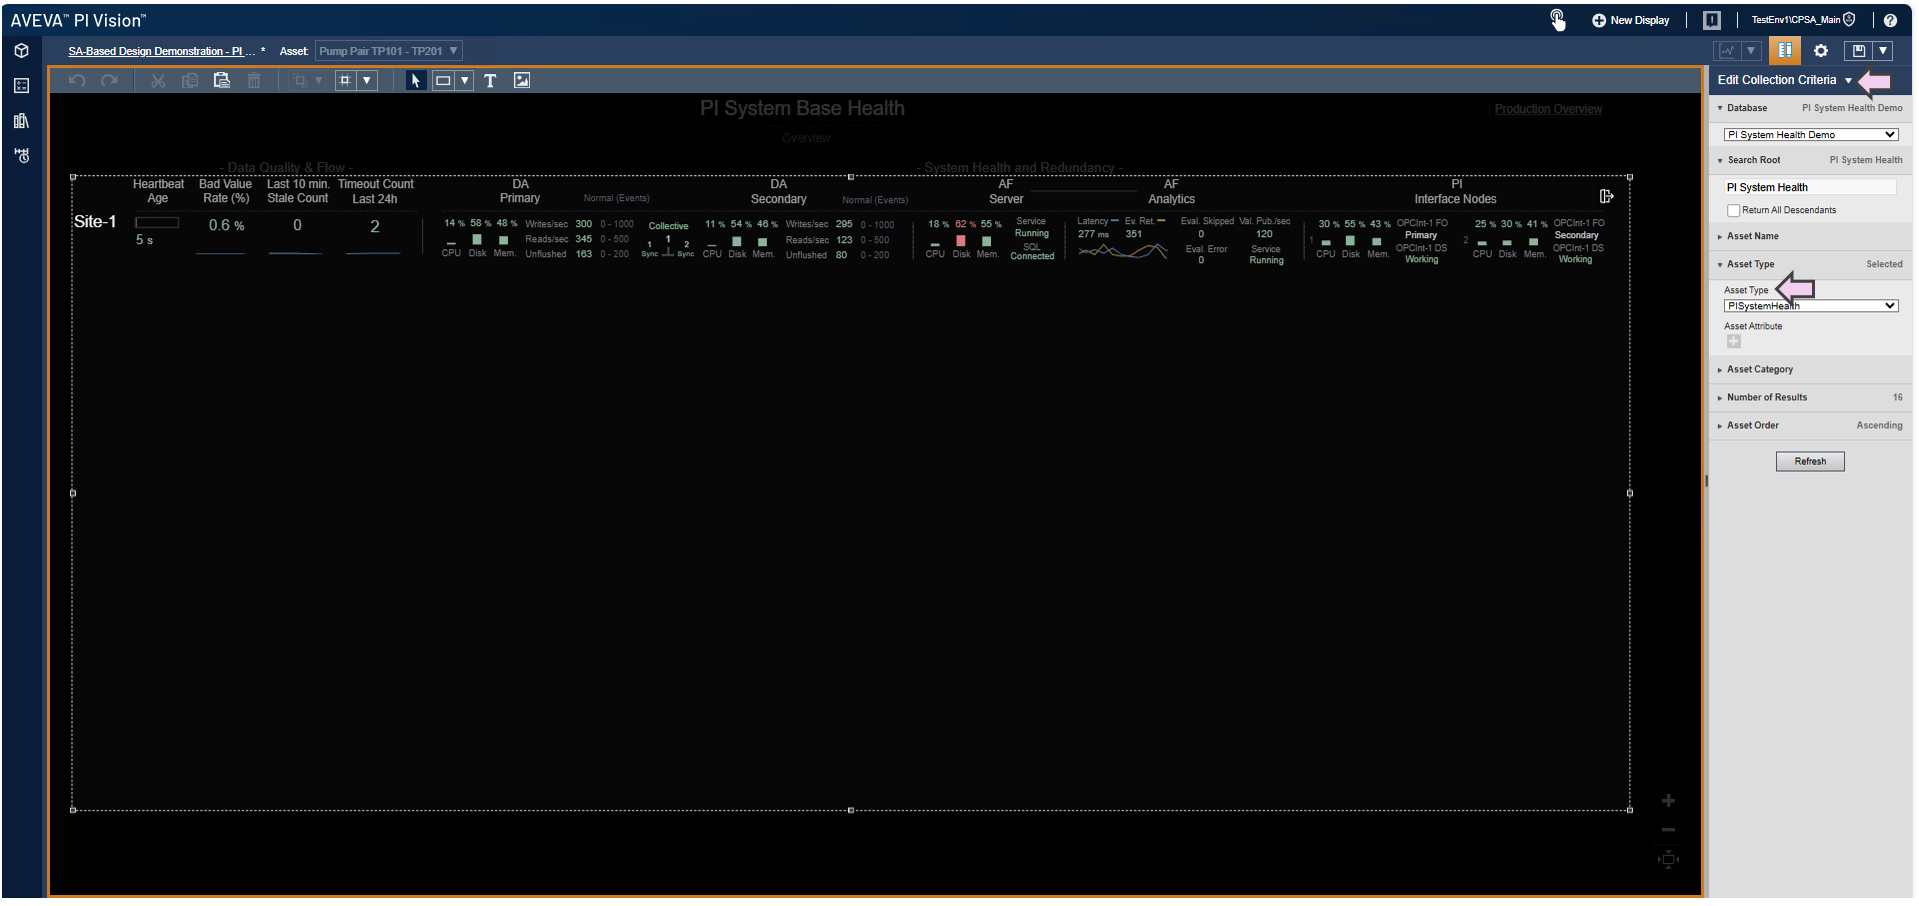
- Key Configuration: The dashboard uses Collections for dynamic
multi-asset rendering, along with Multi-State and Blink rules for alarm conditions.
Implementation Notes
- The pattern scales naturally by adding new rows for new assets.
- Trends remain intentionally minimal to avoid clutter while enabling projection.
- Ranges and thresholds should appear directly on screen to avoid memory load.
- Alarm treatment must remain visually consistent across all assets.
- While demonstrated using PI Systems, this pattern applies to any repeated asset type.
References:
Stephen Few — Information Dashboard Design
Mica R. Endsley & Debra G. Jones — Designing for Situation Awareness
Pattern demonstrated within the Clear Picture SA framework.